At first glance, our zoning clearances dataset seems rather boring and even constrained. We have all factor data, and most of the variables are iterations of the same concept: a particular entity that can or cannot be zoned in a given area in Boston. And what can be done with entirely theoretical data? Just because a theater or grocery store can be zoned somewhere does not necessarily mean that it is zoned there, and this particular dataset provides no information on the subject.
So what can be done with this data set? Thus far we have barely scratched the surface, spending most of our time trying to grasp what data we have, putting it together to get a hazy picture of Boston geographically. But I’m beginning to wonder if the source of the frustration can also be the key to discovery: this data set describes what Boston could be. Why not use it to dream and strategize a little?
Imagine Boston 2030 is a visioning process led by Mayor Walsh with the goal of creating the first citywide plan in fifty years. City staff are thinking about many themes, such as housing, parks, land use, and learning, all of which will be woven together into a strategic plan for Boston. Zoning is obviously linked to city planning. What kinds of questions or ideas might this zoning clearances data set add to the Imagine Boston conversation?
I have already been mulling over three different latent constructs that might be measurable in this data set, all of which relate to the Boston’s planning and visioning process. The first is one we discussed as a small group in class: that of healthy communities. How would knowing which neighborhoods or areas of Boston might be the healthiest add to the conversations being held in City Hall?
 Of course, the term healthy communities can be interpreted in several ways, each of which, I would argue, is a secondary latent variable, as the image to the right shows. Encompassed within the idea of a healthy community could be three distinct ideas, each of which is a theme found on the Imagine Boston 2030 website: parks and open space, health and safety, and environment or being a green city. Each of these latent variables has their own manifest variables, as shown.
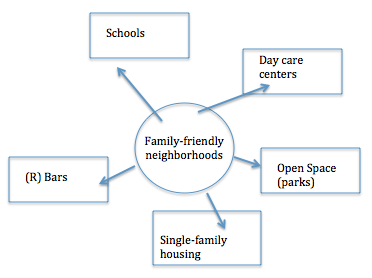
 The second and third ideas are linked. Both pertain to housing. Boston is a fantastic city, but it is on the precipice of a housing crisis. Will there be enough affordable housing? Over the next fifty years, will families live in communities that meet their needs?
Most, if not all, of these variables already exist in my data set. I can look up preschools, bars, multi-family housing, and parks/open space and see whether they are allowed, conditionally allowed, or forbidden in any given area of the city. I imagine I could also create new variables that would function as indices. An environmental index, for example, might combine several existing variables and rank them, giving the area a score of some kind. Additionally, I would have to consider density of these areas as well. If one tiny area is eligible for a bar, surrounded by a vast area with everything else “good” for families, the potential presence of one bar is likely not an indicator of a “bad” neighborhood. If, however, many sub district areas allow banks, that may raise a red flag of concern that would require further investigation or nuanced interpretation.
Of course, again, all of this information is purely hypothetical. Regardless of how many sub districts allow bars, my dataset does not tell me how many (or if any) exist. Again, a particular neighborhood might be found to be zoned well for affordable housing, but I would have no way of knowing whether or not affordable housing is there, or even what housing is there. I approach this dilemma with two thoughts. First, I could team up with some of the tax assessors group members and see what the records indicate. Second, I could consider my role to be to take the first of several steps: these questions and measurements could provide a template that could be presented to the City. “Here: look at these neighborhoods. They seem to be zoned perfectly for families. Now you can put together a research team to go see if that’s true, and if not, we can strategize about to change that.”
Hypothetical data that is descriptive rather than numeric does not have to be simple and underutilized. This data set could be a tool for scouting out a template for designing the best Boston – for 2030 and the fifty years that follow.
